Blogs | Dawn Journal | March 30, 2017
Dear Leonardo dawn Vinci, Micheldawngelo and Other Artistic Readers,

Now in its third year of orbiting a distant dwarf planet, a spacecraft from Earth is as active as ever. Like a master artist, Dawn is working hard to add fine details to its stunning portrait of Ceres.
In this phase of its extended mission, the spacecraft’s top priority is to record space radiation (known as cosmic rays) in order to refine its earlier measurements of the atomic species down to about a yard (meter) underground. The data Dawn has been collecting are excellent.
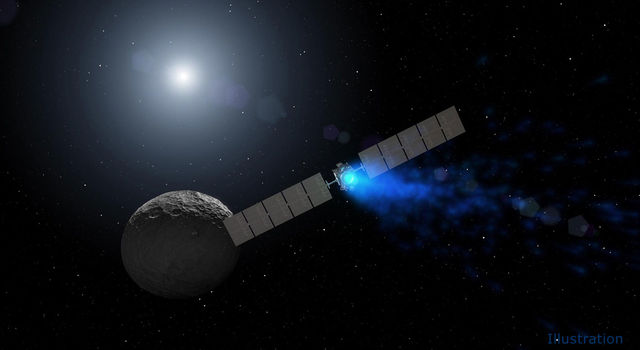
As we explained in January, the ambitious mission has added a complex bonus to its plans. The team is piloting the ship through an intricate set of space maneuvers to dramatically shift its orbit around Ceres. They are now about halfway through, and it has been smooth sailing. Dawn is on course and on schedule. (If you happen to be one of the few readers for whom it isn’t second nature to plan how to change a spacecraft’s orbit around a dwarf planet by 90 degrees and then fly it under control of ion engine, last month’s Dawn Journal presents a few of the details that may not be obvious. And you can follow the adventurer’s orbital progress with the regular mission status updates.)
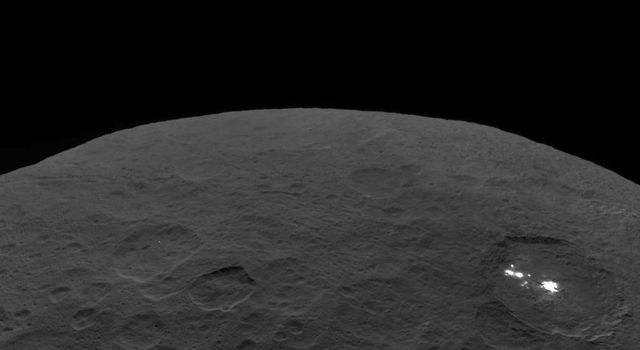
If all goes well, on April 29 the new orbit will take Dawn exactly between the sun and the famous bright region at the center of Occator Crater. Named Cerealia Facula, the area is composed largely of salts. (Based on infrared spectra, the strongest candidate for the primary constituent is sodium carbonate). The probe will be at an altitude of about 12,400 miles (20,000 kilometers), or more than 50 times higher than it was in 2016 when it captured its sharpest photos of Occator (as well as the rest of Ceres’ 1.1 million square miles, or 2.8 million square kilometers). But the objective of reaching a position at which the sun and Ceres are in opposite directions, a special alignment known as opposition, is not to take pictures that display more details to our eyes. In fact, however, the pictures will contain intriguing new details that are not readily discerned by visual inspection. Dawn will take pictures as it gets closer and closer to opposition, covering a range of angles. In each image, scientists will scrutinize the handful of pixels on Cerealia Facula to track how the brightness changes as Dawn’s vantage point changes.

We described the opposition surge, in which the reflected sunlight at opposition may be significantly brighter than it is in any other geometrical arrangement. A few degrees or even a fraction of a degree can make a large difference. But why is that? What is the underlying reason for the opposition surge? What can we learn by measuring it? And is the best cake better than the best candy?
Those are all interesting and important questions. We will address some of them here and leave the rest for your own thorough investigation.
There are at least three separate physical effects that may contribute to the opposition surge. One of them is known as shadow hiding. When the sun shines on the ground, tiny irregularities in the surface, even at the microscopic level, will cast shadows. When you look at the ground, those shadows collectively detract from its overall brightness, even if each individual shadow is too small for you to see. The total amount of light reflected off the ground and into your eyes (or your camera) is less than it would be if every point, no matter how small, were well lit. However, if you look along the same direction as the incoming light, then all the shadows will be hidden. They will all be on the opposite side of those tiny irregularities, out of reach of both the incident light and your sight. In that case, anything you can see will be illuminated, and the scene will be brighter. The figure below is intended to illustrate this phenomenon of shadow hiding (and excluding the caption, the picture is probably worth almost 480 words).

The opposition surge was first described scientifically in 1887 by Hugo von Seeliger, an accomplished astronomer and highly esteemed teacher of astronomers. He analyzed data collected by Gustav Müller when Earth’s and Saturn’s orbits around the sun brought Saturn into opposition, and the brightness of the rings increased unexpectedly. Seeliger realized that shadow hiding among the myriad particles in the rings could explain Müller’s observations. The opposition surge is occasionally known as the Seeliger effect. (Although astronomers had been observing the rings for more than two centuries by then, a careful scientific analysis to show that the rings were not solid but rather composed of many small particles had only been completed about 30 years before Seeliger’s advance.)
Now astronomers recognize the opposition surge on many solar system bodies, including Earth’s moon and the moons of other planets, as well as Mars and asteroids. In fact, it also occurs on many materials on Earth, including vegetation. Scientists exploit the phenomenon to determine the character of materials at a distance when they can make careful measurements at opposition.
For many solar system objects, however, it is difficult or impossible to position the observer along the line between the sun and the target. But thanks to the extraordinary maneuverability provided by Dawn’s ion engine, we may be able to perform the desired measurement in Occator Crater.

It was nearly a century after Seeliger’s description of shadow hiding before scientists realized that there is another contributor to the opposition surge, which we mention only briefly here. It depends on the principle of constructive interference, which applies more in physics than in politics. Waves (in this case, light waves) that have their crests at the same places can add up to be especially strong (which makes the light bright). (Destructive interference, which may be more evident outside of the physics realm, occurs when troughs of one wave cancel crests of another.) We will not delve into why constructive interference tends to occur at opposition, but anyone with a thorough understanding of classical electromagnetic theory can work it out, as physicists did in the 1960s to 1980s. (More properly, it should be formulated not classically but quantum mechanically, but we recognize that some readers will prefer the former methodology because it is, as one physicist described it in 1968, "much simpler and more satisfying to the physical intuition." So, why make it hard?) For convenient use to ruin parties, the most common term for constructive interference in the opposition surge is coherent backscatter, but it sometimes goes by the other comparably self-explanatory terms weak photon localization and time reversal symmetry. Regardless of the name, as the light waves interact with the material they are illuminating at opposition, constructive interference can produce a surge in brightness.
The intensity of the opposition surge depends on the details of the material reflecting the light. Even the relative contributions of shadow hiding and coherent backscatter depend on the properties of the materials. (While both cause the reflected light to grow stronger as the angle to opposition shrinks, coherent backscatter tends to dominate at the very smallest angles.)
Especially sensitive laboratory measurements show that sometimes shadow hiding and coherent backscatter together are not sufficient to explain the result, so there must be even more to the opposition surge. The unique capability of science to explain the natural world, shown over and over and over again during the last half millennium, provides confidence that a detailed theoretical understanding eventually will be attained.
Part of science’s success derives from its combination of experiment and theory. For now, however, the opposition surge is more in the domain of the former than the latter. In other words, translating any opposition surge observation into a useful description of the properties of the reflecting material requires controlled laboratory measurements of well characterized materials. They provide the basis for interpreting the observation.

If Dawn accomplishes the tricky measurements (which we will describe next month), scientists will compare the Cerealia Facula opposition surge with lab measurements of the opposition surge. As always in good science, to establish the details of the experiments, they will start by integrating the knowledge already available, including the tremendous trove of data Dawn has already collected -- spectra of neutrons, gamma rays, visible light and infrared light plus extensive color and stereo photography and gravity measurements. In the context of their understanding of physics, chemistry and geology throughout the solar system, scientists will determine not only the mixtures of chemicals to test but also the properties such as grain sizes and how densely packed the particles are. They will perform experiments then on many combinations of credible facular composition and properties. Comparing those results with Dawn’s findings, they will be able to elucidate more about what really is on the ground in that mesmerizing crater. For example, if they determine the salt crystals are small, that may mean that salty water had been on the ground and sublimated quickly in the vacuum of space. But if the salt came out of solution more slowly underground and was later pushed to the surface by other geological processes, the crystals would be larger.
It is an impressive demonstration of the power of science that we can navigate an interplanetary spaceship to a particular location high above the mysterious, lustrous landscape of a distant alien world and gain insight into some details that would be too fine for you to see even if you were standing on the ground. Using the best of science, Dawn is teasing every secret it can from a relict from the dawn of the solar system. On behalf of everyone who appreciates the majesty of the cosmos, our dedicated, virtuoso artist is adding exquisite touches to what is already a masterpiece.
Dawn is 31,400 miles (50,500 kilometers) from Ceres. It is also 3.48 AU (324 million miles, or 521 million kilometers) from Earth, or 1,430 times as far as the moon and 3.48 times as far as the sun today. Radio signals, traveling at the universal limit of the speed of light, take 58 minutes to make the round trip.
Dr. Marc D. Rayman
4:00 p.m. PDT March 30, 2017
TAGS:DAWN, BLOG, JOURNAL, CERES, VESTA